
Linked Visualizations
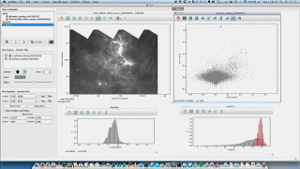
With glue, users can create scatter plots, histograms and images (2D and 3D) of their data. glue is focused on the brushing and linking paradigm, where selections in any graph propagate to all others.

Flexible linking across data
glue uses the logical links that exist between different data sets to overlay visualizations of different data, and to propagate selections across data sets. These links are specified by the user, and are arbitrarily flexible

Full scripting capability
glue is written in Python, and built on top of its standard scientific libraries (i.e., Numpy, Matplotlib, Scipy). Users can easily integrate their own python code for data input, cleaning, and analysis.
glue is a multi-disciplinary tool
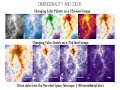
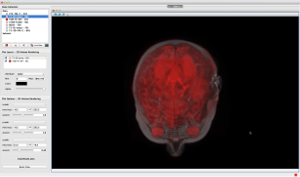
Designed from the ground up to be applicable to a wide variety of data, glue is being used on astronomy data of star forming-clouds, medical data including brain scans, and many other kinds of data.
Video: What is glue?
A 2-minute introduction summarizing what glue is capable of.
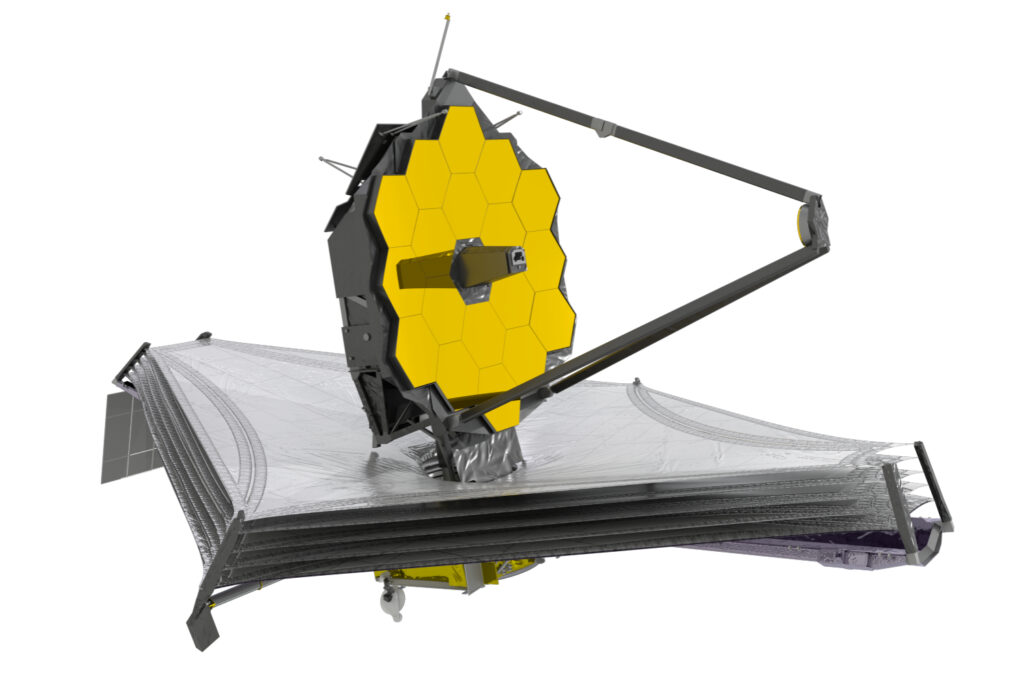
Blog: glue ❤ JWST
A match made for the heavens! Read about how glue was initially funded by, and learn why it's so important to, the James Webb Space Telescope.
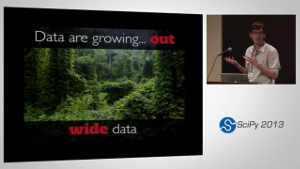
Video: Talk at SciPy 2013
An overview talk of glue by Chris Beaumont at the SciPy 2013 meeting.
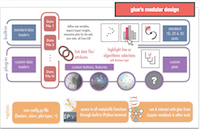
Poster: 2018 NSF SI2 PI Meeting
glue: Linked-View Exploratory Visualization of High-Dimensional Data, for Everyone
Video: Greece 2018
glueing the Universe by Alyssa Goodman at the Olympian Symposium 2018: Gas and stars from milli- to mega- parsecs meeting.
Video: Talk at CfA 2016
An overview talk of glue by Thomas Robitaille at the Harvard-Smithsonian Center for Astrophysics.
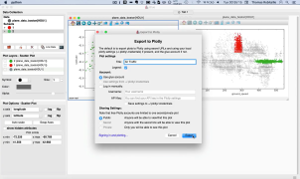
Video: Exporting to Plotly
Demonstration of exporting plots to Plotly from inside glue.

Video: Learn to fly glue, fast
A 6-minute tutorial demonstrating many core features of glue. Go here for the full demo, including all necessary files.
Video: glue in 2 minutes
A 2-minute introductory glue demo, highlighting the concepts of linking and brushing.


